Citation Information
van ’t Wout AB, Lehrman GK, Mikheeva SA, O'Keeffe GC, Katze MG, Bumgarner RE, Geiss GK, Mullins JI (2003). Cellular gene expression upon human immunodeficiency virus type 1 infection of CD4(+)-T-cell lines. Journal of virology, 77(2), 1392-402. (pubmed)
Abstract
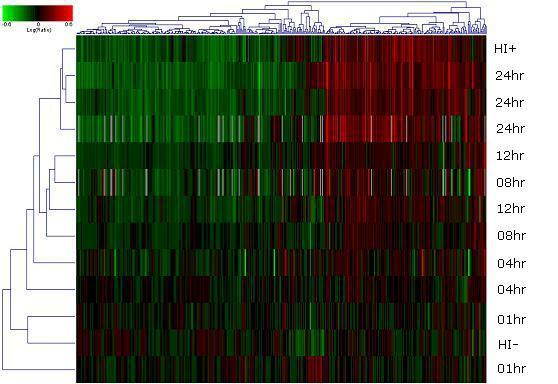
The expression levels of approximately 4,600 cellular RNA transcripts were assessed in CD4(+)-T-cell lines at different times after infection with human immunodeficiency virus type 1 strain BRU (HIV-1(BRU)) using DNA microarrays. We found that several classes of genes were inhibited by HIV-1(BRU) infection, consistent with the G(2) arrest of HIV-1-infected cells induced by Vpr. These included genes involved in cell division and transcription, a family of DEAD-box proteins (RNA helicases), and all genes involved in translation and splicing. However, the overall level of cell activation and signaling was increased in infected cells, consistent with strong virus production. These included a subgroup of transcription factors, including EGR1 and JUN, suggesting they play a specific role in the HIV-1 life cycle. Some regulatory changes were cell line specific; however, the majority, including enzymes involved in cholesterol biosynthesis, of changes were regulated in most infected cell lines. Compendium analysis comparing gene expression profiles of our HIV-1 infection experiments to those of cells exposed to heat shock, interferon, or influenza A virus indicated that HIV-1 infection largely induced specific changes rather than simply activating stress response or cytokine response pathways. Thus, microarray analysis confirmed several known HIV-1 host cell interactions and permitted identification of specific cellular pathways not previously implicated in HIV-1 infection. Continuing analyses are expected to suggest strategies for impacting HIV-1 replication in vivo by targeting these pathways.
Supplemental Data
Raw Data: van ’t Wout et al
retrieve raw
data
Supplemental Data: van ’t Wout et al.
Supplement S1.
Supplement S2.
Supplement S3.
Supplement S1. Gene groups up regulated (red) or
down regulated (green) by HIV-1BRU infection of CCRF-CEM
cells.** Genes involved in cell signaling and communication were mostly
up regulated, whereas genes involved in gene and protein expression were
mostly down
regulated.
| Group |
Up (%) |
Down (%) |
Total (%) |
| Cell division |
4 (2) |
13 (5) |
17 (4) |
| Defense |
2 (1) |
3 (1) |
5 (1) |
| DNA binding |
1 (1) |
10 (4) |
11 (3) |
| Protein processing |
7 (4) |
11 (5) |
18 (4) |
| Ribosomal |
1 (1) |
6 (2) |
7 (2) |
| RNA binding |
2 (1) |
8 (3) |
10 (2) |
| RNA helicase |
0 (0) |
7 (3) |
7 (2) |
| Splicing |
0 (0) |
8 (3) |
8 (2) |
| Translation |
0 (0) |
10 (4) |
10 (2) |
| Transcription |
17 (10) |
31 (13) |
48 (12) |
| Enzyme |
22 (13) |
31 (13) |
53 (13) |
| Transporter |
8 (5) |
10 (4) |
18 (4) |
| Apoptosis |
3 (2) |
1 (0) |
4 (1) |
| Channel |
3 (2) |
1 (0) |
4 (1) |
| Kinase |
6 (4) |
4 (2) |
10 (2) |
| Ligand |
4 (2) |
0 (0) |
4 (1) |
| Phosphatase |
1 (1) |
4 (0) |
5 (1) |
| Receptor |
22 (13) |
8 (3) |
30 (7) |
| Transducer |
17 (10) |
8 (3) |
25 (6) |
| Adhesion |
4 (2) |
6 (2) |
10 (2) |
| Cytoskeleton |
11 (7) |
3 (1) |
14 (3) |
| Unknown |
30 (18) |
61 (25) |
91 (22) |
| Total |
165 |
244 |
409 |
Supplement S2. Genes regulated by
HIV-1BRU infection of CCRF-CEM cells. Tables, sorted by
functional category, depict gene order in hierarchical cluster (S1),
IMAGE consortium clone number, gene name, functional group and mean and
standard deviation of the array ratios in the four 24 hour infection
experiments.
Cell Division
| No. |
Image |
Name |
Group |
Mean |
S.D. |
| 18 |
66919 |
APC7 |
cell cycle |
-0.14 |
0.04 |
| 22 |
788645 |
G3BP |
cell cycle |
-0.14 |
0.09 |
| 134 |
22918 |
P40 |
cell cycle |
-0.14 |
0.04 |
| 34 |
247925 |
DRIM |
cell cycle |
-0.11 |
0.05 |
| 189 |
842806 |
CDK4 |
cell cycle |
-0.11 |
0.03 |
| 41 |
724615 |
CHC1 |
cell cycle |
-0.10 |
0.04 |
| 184 |
358736 |
GSPT2 |
cell cycle |
-0.09 |
0.03 |
| 1 |
292806 |
CSE1L |
cell cycle |
-0.08 |
0.03 |
| 54 |
843049 |
MCM4 |
cell cycle |
-0.08 |
0.03 |
| 109 |
784830 |
D123 |
cell cycle |
-0.08 |
0.06 |
| 215 |
214572 |
CDK6 |
cell cycle |
-0.06 |
0.09 |
| 171 |
159118 |
ARHG |
cell cycle |
-0.05 |
0.08 |
| 176 |
809557 |
MCM3 |
cell cycle |
-0.04 |
0.09 |
| 368 |
841332 |
ARHGDIB |
cell cycle |
0.08 |
0.01 |
| 355 |
249705 |
DSS1 |
cell cycle |
0.09 |
0.07 |
| 360 |
823691 |
CCNG2 |
cell cycle |
0.15 |
0.04 |
| 267 |
207288 |
INSIG1 |
cell cycle |
0.26 |
0.06 |
Cell/Organism Defense
| No. |
Image |
Name |
Group |
Mean |
S.D. |
| 12 |
207029 |
PTMA |
defense |
-0.14 |
0.04 |
| 273 |
703581 |
PRG1 |
defense |
0.16 |
0.01 |
| 66 |
824031 |
HSJ2 |
heat shock |
-0.19 |
0.03 |
| 59 |
781341 |
HSPE1 |
heat shock |
-0.13 |
0.04 |
| 293 |
546600 |
HLJ1 |
heat shock |
0.14 |
0.04 |
Gene/Protein Expression
| No. |
Image |
Name |
Group |
Mean |
S.D. |
| 111 |
293576 |
TARDBP |
dna binding |
-0.13 |
0.02 |
| 107 |
27548 |
NUP153 |
dna binding |
-0.12 |
0.09 |
| 36 |
205445 |
H1F0 |
dna binding |
-0.11 |
0.04 |
| 63 |
950574 |
TAF |
dna binding |
-0.11 |
0.06 |
| 149 |
144894 |
MMS19L |
dna binding |
-0.09 |
0.01 |
| 180 |
773599 |
RBBP4 |
dna binding |
-0.06 |
0.01 |
| 208 |
129506 |
SSRP1 |
dna binding |
-0.06 |
0.02 |
| 163 |
789091 |
H2AFL |
dna binding |
-0.04 |
0.08 |
| 231 |
240151 |
ID2 |
dna binding |
0.01 |
0.07 |
| 222 |
136073 |
BRD4 |
dna binding |
0.04 |
0.11 |
| 351 |
753447 |
DDB2 |
dna binding |
0.09 |
0.04 |
| 193 |
204111 |
HMGE |
protein processing |
-0.16 |
0.05 |
| 186 |
840517 |
PSME3 |
protein processing |
-0.15 |
0.08 |
| 64 |
788574 |
GCN5L2 |
protein processing |
-0.14 |
0.05 |
| 93 |
839682 |
UBE2N |
protein processing |
-0.11 |
0.04 |
| 60 |
243343 |
CCT2 |
protein processing |
-0.09 |
0.02 |
| 126 |
840325 |
UBL4 |
protein processing |
-0.09 |
0.03 |
| 197 |
43884 |
PPIF |
protein processing |
-0.08 |
0.08 |
| 21 |
232612 |
LMAN1 |
protein processing |
-0.06 |
0.06 |
| 27 |
123700 |
USP7 |
protein processing |
-0.06 |
0.03 |
| 174 |
241900 |
PPIA |
protein processing |
-0.06 |
0.02 |
| 218 |
843140 |
KDELR2 |
protein processing |
-0.02 |
0.03 |
| 354 |
51814 |
CSTB |
protein processing |
0.08 |
0.03 |
| 283 |
760298 |
PRSC1 |
protein processing |
0.10 |
0.06 |
| 332 |
83083 |
ITIH3 |
protein processing |
0.12 |
0.08 |
| 320 |
139573 |
RNPEP |
protein processing |
0.13 |
0.06 |
| 335 |
143887 |
SPUVE |
protein processing |
0.14 |
0.08 |
| 272 |
243202 |
CTSE |
protein processing |
0.16 |
0.05 |
| 257 |
898035 |
CTSB |
protein processing |
0.17 |
0.09 |
| 142 |
125148 |
RNAC |
ribosomal |
-0.21 |
0.05 |
| 137 |
824568 |
MRPL4 |
ribosomal |
-0.16 |
0.03 |
| 127 |
321354 |
HSPC228 |
ribosomal |
-0.15 |
0.03 |
| 144 |
246041 |
MRPS35 |
ribosomal |
-0.15 |
0.04 |
| 200 |
44255 |
RPML3 |
ribosomal |
-0.10 |
0.10 |
| 86 |
292232 |
RPS15A |
ribosomal |
-0.08 |
0.03 |
| 259 |
562867 |
RRS1 |
ribosomal |
0.28 |
0.05 |
| 132 |
236055 |
PAI-RBP1 |
rna binding |
-0.20 |
0.04 |
| 147 |
841352 |
RBMX |
rna binding |
-0.16 |
0.05 |
| 113 |
842820 |
PABPC4 |
rna binding |
-0.11 |
0.05 |
| 112 |
897594 |
RNPS1 |
rna binding |
-0.09 |
0.03 |
| 83 |
26711 |
NCBP2 |
rna binding |
-0.08 |
0.02 |
| 89 |
703739 |
NCBP1 |
rna binding |
-0.07 |
0.03 |
| 16 |
782449 |
PCBP2 |
rna binding |
-0.05 |
0.02 |
| 204 |
124138 |
NXF1 |
rna binding |
-0.05 |
0.04 |
| 405 |
33690 |
CPSF6 |
rna binding |
0.01 |
0.03 |
| 362 |
814526 |
RNPC1 |
rna binding |
0.18 |
0.05 |
| 65 |
814117 |
DDX21 |
rna helicase |
-0.22 |
0.06 |
| 148 |
127925 |
DDX18 |
rna helicase |
-0.14 |
0.03 |
| 48 |
838373 |
DDX9 |
rna helicase |
-0.11 |
0.01 |
| 19 |
241880 |
DDX24 |
rna helicase |
-0.09 |
0.04 |
| 37 |
250519 |
DDX? |
rna helicase |
-0.09 |
0.06 |
| 194 |
773192 |
DDX1 |
rna helicase |
-0.05 |
0.02 |
| 237 |
741841 |
DDX11 |
rna helicase |
-0.05 |
0.11 |
| 157 |
202904 |
HSSG1 |
splicing |
-0.19 |
0.05 |
| 47 |
80399 |
SFRS1 |
splicing |
-0.15 |
0.02 |
| 146 |
47681 |
SFRS10 |
splicing |
-0.15 |
0.03 |
| 58 |
950092 |
SFRS3 |
splicing |
-0.11 |
0.03 |
| 170 |
123400 |
FBP2 |
splicing |
-0.04 |
0.09 |
| 219 |
345208 |
ELAVL1 |
splicing |
-0.03 |
0.06 |
| 246 |
898265 |
SFRS5 |
splicing |
0.01 |
0.07 |
| 226 |
48530 |
PPIG |
splicing |
0.03 |
0.06 |
| 183 |
812965 |
MYC |
transcription |
-0.39 |
0.07 |
| 91 |
843016 |
P130 |
transcription |
-0.24 |
0.05 |
| 82 |
823851 |
AEBP1 |
transcription |
-0.20 |
0.07 |
| 185 |
782811 |
HMGIY |
transcription |
-0.19 |
0.04 |
| 158 |
126702 |
ZNF202 |
transcription |
-0.17 |
0.04 |
| 74 |
824602 |
IFI16 |
transcription |
-0.16 |
0.04 |
| 136 |
713839 |
TFAP4 |
transcription |
-0.16 |
0.05 |
| 72 |
814101 |
TFDP2 |
transcription |
-0.15 |
0.01 |
| 28 |
280735 |
TBP |
transcription |
-0.13 |
0.03 |
| 57 |
949971 |
ATF4 |
transcription |
-0.13 |
0.01 |
| 103 |
773188 |
NR1D2 |
transcription |
-0.13 |
0.04 |
| 145 |
789049 |
NFYA |
transcription |
-0.13 |
0.04 |
| 172 |
809892 |
SEMA3B |
transcription |
-0.12 |
0.08 |
| 182 |
321708 |
TFDP1 |
transcription |
-0.12 |
0.06 |
| 52 |
322759 |
SNAPC5 |
transcription |
-0.10 |
0.01 |
| 99 |
786048 |
E2F4 |
transcription |
-0.10 |
0.01 |
| 119 |
711680 |
ZNFN1A1 |
transcription |
-0.10 |
0.03 |
| 85 |
825478 |
ZNF146 |
transcription |
-0.09 |
0.04 |
| 162 |
365930 |
TAF7 |
transcription |
-0.08 |
0.05 |
| 165 |
785816 |
ILF3 |
transcription |
-0.08 |
0.03 |
| 195 |
785845 |
TFAM |
transcription |
-0.08 |
0.05 |
| 203 |
361171 |
HTATIP |
transcription |
-0.07 |
0.10 |
| 214 |
809648 |
ZNF162 |
transcription |
-0.07 |
0.11 |
| 78 |
781018 |
SMARCB1 |
transcription |
-0.06 |
0.04 |
| 161 |
511814 |
ZNF38 |
transcription |
-0.06 |
0.03 |
| 96 |
80772 |
NCOR2 |
transcription |
-0.05 |
0.03 |
| 201 |
230218 |
GCN5L1 |
transcription |
-0.05 |
0.04 |
| 239 |
244058 |
JPO1 |
transcription |
-0.04 |
0.08 |
| 205 |
756272 |
TCF7 |
transcription |
-0.03 |
0.05 |
| 409 |
131626 |
NFRKB |
transcription |
-0.02 |
0.08 |
| 220 |
142395 |
HCFC1 |
transcription |
0.01 |
0.08 |
| 225 |
773215 |
RUNX1 |
transcription |
0.02 |
0.08 |
| 241 |
111981 |
LRRFIP1 |
transcription |
0.03 |
0.11 |
| 397 |
280882 |
FLI1 |
transcription |
0.03 |
0.04 |
| 398 |
297731 |
ZNF9 |
transcription |
0.05 |
0.07 |
| 290 |
774082 |
ASCL1 |
transcription |
0.06 |
0.02 |
| 378 |
287300 |
MLLT10 |
transcription |
0.07 |
0.20 |
| 256 |
71727 |
TAL1 |
transcription |
0.09 |
0.06 |
| 279 |
241412 |
ELF1 |
transcription |
0.09 |
0.05 |
| 345 |
789357 |
RELB |
transcription |
0.10 |
0.03 |
| 406 |
214068 |
GATA3 |
transcription |
0.10 |
0.07 |
| 286 |
229723 |
SP140 |
transcription |
0.12 |
0.04 |
| 324 |
741067 |
SMARCD2 |
transcription |
0.12 |
0.03 |
| 310 |
196501 |
ARP |
transcription |
0.17 |
0.06 |
| 348 |
45291 |
DRPLA |
transcription |
0.18 |
0.03 |
| 297 |
246722 |
TNRC3 |
transcription |
0.21 |
0.04 |
| 372 |
358531 |
JUN |
transcription |
0.30 |
0.16 |
| 336 |
840944 |
EGR1 |
transcription |
0.36 |
0.18 |
| 55 |
511586 |
HNRPA1 |
translation |
-0.13 |
0.02 |
| 100 |
204614 |
EIF4A1 |
translation |
-0.13 |
0.04 |
| 88 |
840384 |
GRSF1 |
translation |
-0.11 |
0.03 |
| 8 |
214577 |
RPP20 |
translation |
-0.10 |
0.02 |
| 73 |
327350 |
HNRPA2B1 |
translation |
-0.10 |
0.04 |
| 156 |
358457 |
HNRPH1 |
translation |
-0.10 |
0.03 |
| 117 |
949934 |
HNRPA0 |
translation |
-0.08 |
0.05 |
| 24 |
380394 |
EIF1AY |
translation |
-0.07 |
0.03 |
| 153 |
307532 |
EIF4A2 |
translation |
-0.07 |
0.06 |
| 187 |
236305 |
HARS |
translation |
-0.07 |
0.02 |
Metabolism
| No. |
Image |
Name |
Group |
Mean |
S.D. |
| 101 |
180244 |
ABCC8 |
transporter |
-0.16 |
0.04 |
| 3 |
841703 |
TFRC |
transporter |
-0.14 |
0.06 |
| 110 |
153006 |
SLC19A1 |
transporter |
-0.14 |
0.08 |
| 188 |
308682 |
ABCF2 |
transporter |
-0.13 |
0.03 |
| 167 |
825451 |
P115 |
transporter |
-0.12 |
0.18 |
| 105 |
320903 |
SLC25A6 |
transporter |
-0.10 |
0.04 |
| 45 |
825677 |
ASNA1 |
transporter |
-0.09 |
0.03 |
| 213 |
815285 |
ERPROT213 |
transporter |
-0.07 |
0.08 |
| 20 |
250667 |
RAB9 |
transporter |
-0.06 |
0.06 |
| 198 |
80946 |
ABCE1 |
transporter |
-0.05 |
0.20 |
| 339 |
245853 |
AP2B1 |
transporter |
0.05 |
0.04 |
| 371 |
898253 |
RCN2 |
transporter |
0.05 |
0.05 |
| 370 |
199286 |
ATP11B |
transporter |
0.06 |
0.03 |
| 275 |
841340 |
ABCB2 |
transporter |
0.08 |
0.03 |
| 307 |
49352 |
ANXA7 |
transporter |
0.08 |
0.03 |
| 322 |
842784 |
SLC25A3 |
transporter |
0.08 |
0.02 |
| 358 |
139540 |
OSPBL3 |
transporter |
0.08 |
0.03 |
| 292 |
121981 |
SLC2A3 |
transporter |
0.19 |
0.04 |
| 154 |
79502 |
MAT2A |
enzyme |
-0.20 |
0.04 |
| 7 |
796646 |
ODC1 |
enzyme |
-0.17 |
0.03 |
| 2 |
49464 |
UNG |
enzyme |
-0.16 |
0.05 |
| 116 |
25679 |
SRD5A1 |
enzyme |
-0.16 |
0.09 |
| 92 |
813280 |
ADSL |
enzyme |
-0.14 |
0.03 |
| 5 |
814615 |
MTHFD2 |
enzyme |
-0.13 |
0.03 |
| 40 |
242687 |
B3GNT1 |
enzyme |
-0.13 |
0.03 |
| 125 |
813711 |
ADH5 |
enzyme |
-0.13 |
0.03 |
| 190 |
300103 |
NAGLU |
enzyme |
-0.13 |
0.03 |
| 51 |
760344 |
UMPS |
enzyme |
-0.12 |
0.02 |
| 151 |
812155 |
RABGGTB |
enzyme |
-0.12 |
0.05 |
| 199 |
126243 |
HMBS |
enzyme |
-0.12 |
0.14 |
| 14 |
46182 |
CTPS |
enzyme |
-0.11 |
0.05 |
| 30 |
127509 |
GBE1 |
enzyme |
-0.11 |
0.07 |
| 179 |
179232 |
PP |
enzyme |
-0.11 |
0.04 |
| 33 |
357091 |
HS6ST |
enzyme |
-0.10 |
0.02 |
| 50 |
813830 |
CYC1 |
enzyme |
-0.10 |
0.02 |
| 129 |
145132 |
MPDU1 |
enzyme |
-0.10 |
0.02 |
| 10 |
898123 |
GART |
enzyme |
-0.09 |
0.04 |
| 62 |
755239 |
METTL1 |
enzyme |
-0.09 |
0.03 |
| 121 |
530875 |
TKT |
enzyme |
-0.09 |
0.04 |
| 26 |
841370 |
GOT2 |
enzyme |
-0.08 |
0.07 |
| 29 |
810316 |
IDH3A |
enzyme |
-0.08 |
0.05 |
| 166 |
299360 |
FBP1 |
enzyme |
-0.08 |
0.02 |
| 115 |
782800 |
UQCRFS1 |
enzyme |
-0.07 |
0.02 |
| 108 |
826077 |
PDHB |
enzyme |
-0.05 |
0.05 |
| 238 |
725533 |
STE |
enzyme |
-0.05 |
0.10 |
| 196 |
292236 |
GPI |
enzyme |
-0.03 |
0.04 |
| 210 |
202535 |
MT1G |
enzyme |
-0.02 |
0.07 |
| 244 |
28012 |
OGT |
enzyme |
-0.01 |
0.10 |
| 393 |
121628 |
HAO1 |
enzyme |
0.00 |
0.08 |
| 232 |
769645 |
NDST2 |
enzyme |
0.02 |
0.04 |
| 395 |
66728 |
FECH |
enzyme |
0.05 |
0.05 |
| 337 |
840990 |
GSTM4 |
enzyme |
0.07 |
0.05 |
| 344 |
212165 |
PRDX2 |
enzyme |
0.07 |
0.05 |
| 304 |
144852 |
PCL1 |
enzyme |
0.08 |
0.02 |
| 329 |
897983 |
AOP2 |
enzyme |
0.09 |
0.03 |
| 278 |
774036 |
GSTTLp28 |
enzyme |
0.10 |
0.03 |
| 305 |
213890 |
DECR1 |
enzyme |
0.10 |
0.05 |
| 327 |
897835 |
OXA1L |
enzyme |
0.10 |
0.04 |
| 308 |
824024 |
NMOR2 |
enzyme |
0.12 |
0.06 |
| 309 |
211780 |
HEXB |
enzyme |
0.12 |
0.03 |
| 312 |
248454 |
ERP70 |
enzyme |
0.14 |
0.06 |
| 300 |
196992 |
AKR1C1 |
enzyme |
0.15 |
0.03 |
| 266 |
124781 |
SQLE |
enzyme |
0.16 |
0.09 |
| 326 |
123474 |
SCD |
enzyme |
0.22 |
0.04 |
| 260 |
739901 |
CYP51 |
enzyme |
0.23 |
0.01 |
| 316 |
840878 |
DHCR24 |
enzyme |
0.24 |
0.04 |
| 333 |
770355 |
LSS |
enzyme |
0.24 |
0.15 |
| 261 |
247901 |
HSD17B7 |
enzyme |
0.26 |
0.06 |
| 264 |
36393 |
ACAT2 |
enzyme |
0.26 |
0.06 |
| 373 |
80410 |
FDPS |
enzyme |
0.31 |
0.08 |
| 294 |
44975 |
IDI1 |
enzyme |
0.35 |
0.11 |
Signaling/Communication
| No. |
Image |
Name |
Group |
Mean |
S.D. |
| 6 |
198904 |
APMCF1 |
apoptosis |
-0.14 |
0.05 |
| 340 |
814381 |
DAP |
apoptosis |
0.08 |
0.07 |
| 302 |
841498 |
DAXX |
apoptosis |
0.10 |
0.03 |
| 347 |
810039 |
DAD1 |
apoptosis |
0.18 |
0.04 |
| 114 |
72050 |
CLNS1A |
channel |
-0.08 |
0.01 |
| 296 |
796341 |
CLCN3 |
channel |
0.09 |
0.02 |
| 408 |
51640 |
CNTN1 |
channel |
0.10 |
0.03 |
| 356 |
45272 |
CLCN6 |
channel |
0.14 |
0.08 |
| 9 |
122091 |
CSNK2A1 |
kinase |
-0.08 |
0.05 |
| 211 |
230385 |
PIP5K2B |
kinase |
-0.07 |
0.05 |
| 235 |
713080 |
CLK2 |
kinase |
-0.07 |
0.10 |
| 216 |
128833 |
PRKWNK1 |
kinase |
-0.05 |
0.10 |
| 247 |
275180 |
SMG1 |
kinase |
0.03 |
0.10 |
| 315 |
302031 |
SLK |
kinase |
0.08 |
0.01 |
| 376 |
841308 |
MYLK |
kinase |
0.08 |
0.11 |
| 377 |
756452 |
TYK2 |
kinase |
0.09 |
0.09 |
| 271 |
138737 |
DYRK2 |
kinase |
0.12 |
0.04 |
| 270 |
33826 |
MAP2K1 |
kinase |
0.17 |
0.05 |
| 255 |
809776 |
IL16 |
ligand |
0.07 |
0.06 |
| 303 |
700302 |
OSTF1 |
ligand |
0.09 |
0.06 |
| 396 |
770670 |
TNFAIP3 |
ligand |
0.09 |
0.31 |
| 364 |
460398 |
MIP1A |
ligand |
0.12 |
0.04 |
| 11 |
825442 |
PTP4A2 |
phosphatase |
-0.15 |
0.04 |
| 35 |
950607 |
SET |
phosphatase |
-0.13 |
0.03 |
| 32 |
129840 |
PPP2CA |
phosphatase |
-0.11 |
0.02 |
| 120 |
42739 |
PTP4A1 |
phosphatase |
-0.09 |
0.06 |
| 382 |
240099 |
PTPRA |
phosphatase |
0.06 |
0.11 |
| 70 |
878838 |
GRM3 |
receptor |
-0.18 |
0.06 |
| 209 |
782789 |
AVPR1A |
receptor |
-0.16 |
0.13 |
| 140 |
241530 |
EPHA2 |
receptor |
-0.13 |
0.06 |
| 118 |
80109 |
HLA-DQA1 |
receptor |
-0.09 |
0.05 |
| 76 |
40365 |
SCAP |
receptor |
-0.08 |
0.03 |
| 90 |
768496 |
EBI3 |
receptor |
-0.08 |
0.04 |
| 77 |
840978 |
CD81 |
receptor |
-0.07 |
0.06 |
| 229 |
757440 |
IL10RA |
receptor |
-0.04 |
0.11 |
| 384 |
838359 |
GUCY1B3 |
receptor |
0.05 |
0.04 |
| 350 |
711857 |
FGFR1 |
receptor |
0.07 |
0.05 |
| 353 |
714453 |
IL4RA |
receptor |
0.09 |
0.04 |
| 392 |
296757 |
GYPA |
receptor |
0.10 |
0.11 |
| 343 |
713145 |
CD44 |
receptor |
0.12 |
0.11 |
| 375 |
137017 |
EGFR |
receptor |
0.12 |
0.00 |
| 388 |
774409 |
ENG |
receptor |
0.12 |
0.13 |
| 249 |
290124 |
IFNGR1 |
receptor |
0.13 |
0.03 |
| 274 |
208001 |
CD59 |
receptor |
0.13 |
0.03 |
| 374 |
810242 |
C3AR1 |
receptor |
0.13 |
0.05 |
| 268 |
785575 |
IFNGR2 |
receptor |
0.14 |
0.07 |
| 253 |
788185 |
TNFRSF10B |
receptor |
0.15 |
0.05 |
| 277 |
231675 |
EVI2A |
receptor |
0.15 |
0.06 |
| 306 |
841149 |
TGFBR2 |
receptor |
0.15 |
0.06 |
| 265 |
842860 |
IL10RB |
receptor |
0.16 |
0.03 |
| 281 |
813254 |
F2R |
receptor |
0.19 |
0.09 |
| 334 |
810017 |
PLAUR |
receptor |
0.19 |
0.08 |
| 269 |
504226 |
CD53 |
receptor |
0.24 |
0.07 |
| 291 |
35828 |
DTR |
receptor |
0.26 |
0.06 |
| 325 |
825295 |
LDLR |
receptor |
0.30 |
0.04 |
| 289 |
770014 |
TRA@ |
receptor |
0.33 |
0.03 |
| 251 |
704459 |
CD69 |
receptor |
0.40 |
0.15 |
| 17 |
754275 |
ARHGEF12 |
transducer |
-0.19 |
0.08 |
| 49 |
230235 |
NGB |
transducer |
-0.18 |
0.03 |
| 46 |
783629 |
HUMAUAG |
transducer |
-0.13 |
0.03 |
| 75 |
711450 |
P84 |
transducer |
-0.12 |
0.02 |
| 79 |
813158 |
DRG2 |
transducer |
-0.09 |
0.02 |
| 67 |
842980 |
DRG1 |
transducer |
-0.08 |
0.01 |
| 175 |
30093 |
RANBP1 |
transducer |
-0.07 |
0.09 |
| 202 |
45544 |
TAGLN2 |
transducer |
-0.04 |
0.11 |
| 404 |
39808 |
PIK3R1 |
transducer |
0.03 |
0.06 |
| 400 |
240249 |
APLP2 |
transducer |
0.08 |
0.03 |
| 280 |
210522 |
PDE7A |
transducer |
0.09 |
0.05 |
| 282 |
815774 |
SLA |
transducer |
0.09 |
0.06 |
| 285 |
810986 |
PPP1R11 |
transducer |
0.09 |
0.02 |
| 301 |
33049 |
CRY1 |
transducer |
0.09 |
0.01 |
| 346 |
81315 |
SEC4L |
transducer |
0.09 |
0.12 |
| 369 |
563444 |
GNAS1 |
transducer |
0.11 |
0.05 |
| 295 |
135083 |
GRP58 |
transducer |
0.12 |
0.02 |
| 367 |
49873 |
MCF2L |
transducer |
0.12 |
0.17 |
| 298 |
898148 |
IQGAP1 |
transducer |
0.13 |
0.02 |
| 361 |
382773 |
MYOZ2 |
transducer |
0.14 |
0.05 |
| 399 |
841008 |
GBP1 |
transducer |
0.14 |
0.08 |
| 349 |
470379 |
STAC |
transducer |
0.15 |
0.08 |
| 287 |
108177 |
P85SPR |
transducer |
0.16 |
0.05 |
| 328 |
813707 |
RGS16 |
transducer |
0.17 |
0.05 |
| 311 |
154482 |
SERPINB1 |
transducer |
0.18 |
0.04 |
Structure/Motility
| No. |
Image |
Name |
Group |
Mean |
S.D. |
| 181 |
235135 |
ITGA4 |
adhesion |
-0.14 |
0.01 |
| 160 |
346545 |
LAMB1 |
adhesion |
-0.08 |
0.03 |
| 206 |
359747 |
LGALS7 |
adhesion |
-0.08 |
0.06 |
| 38 |
342721 |
ITGB2 |
adhesion |
-0.07 |
0.06 |
| 228 |
40751 |
CDH8 |
adhesion |
-0.07 |
0.07 |
| 230 |
145112 |
ICAM1 |
adhesion |
0.01 |
0.09 |
| 366 |
897531 |
MCAM |
adhesion |
0.05 |
0.12 |
| 401 |
136536 |
PCDHGA8 |
adhesion |
0.05 |
0.05 |
| 254 |
810859 |
NK4 |
adhesion |
0.08 |
0.07 |
| 365 |
469969 |
ITGAV |
adhesion |
0.09 |
0.07 |
| 71 |
112525 |
SYNCOILIN |
cytoskeleton |
-0.16 |
0.04 |
| 44 |
825323 |
CKAP1 |
cytoskeleton |
-0.10 |
0.01 |
| 236 |
470930 |
ACTR2 |
cytoskeleton |
-0.05 |
0.10 |
| 383 |
868368 |
TMSB4X |
cytoskeleton |
0.01 |
0.16 |
| 394 |
340558 |
ARPC5 |
cytoskeleton |
0.03 |
0.06 |
| 386 |
131362 |
MSN |
cytoskeleton |
0.06 |
0.06 |
| 387 |
81129 |
MYH9 |
cytoskeleton |
0.06 |
0.04 |
| 288 |
840511 |
VIM |
cytoskeleton |
0.09 |
0.05 |
| 323 |
713886 |
CNN2 |
cytoskeleton |
0.09 |
0.02 |
| 276 |
40562 |
SGCB |
cytoskeleton |
0.10 |
0.03 |
| 331 |
194161 |
ACTN4 |
cytoskeleton |
0.13 |
0.06 |
| 299 |
840788 |
TMSB10 |
cytoskeleton |
0.14 |
0.03 |
| 250 |
841059 |
CAPG |
cytoskeleton |
0.25 |
0.13 |
| 318 |
770080 |
PXN |
cytoskeleton |
0.29 |
0.09 |
Unknown
| No. |
Image |
Name |
Group |
Mean |
S.D. |
| 135 |
130005 |
FLJ14494 |
unknown |
-0.22 |
0.05 |
| 80 |
43977 |
KIAA0182 |
unknown |
-0.21 |
0.04 |
| 56 |
81331 |
EST_81331 |
unknown |
-0.20 |
0.09 |
| 4 |
196866 |
FLJ13340 |
unknown |
-0.19 |
0.09 |
| 139 |
151261 |
MGC5627 |
unknown |
-0.19 |
0.04 |
| 25 |
108425 |
EST_108425 |
unknown |
-0.18 |
0.03 |
| 43 |
108422 |
EST_108422 |
unknown |
-0.18 |
0.03 |
| 94 |
154654 |
EST_154654 |
unknown |
-0.18 |
0.11 |
| 102 |
142944 |
FLJ20037 |
unknown |
-0.18 |
0.06 |
| 69 |
245147 |
EST_245147 |
unknown |
-0.17 |
0.02 |
| 98 |
34106 |
KIAA0153 |
unknown |
-0.17 |
0.04 |
| 15 |
47647 |
FLJ20397 |
unknown |
-0.16 |
0.04 |
| 138 |
470232 |
EST_470232 |
unknown |
-0.16 |
0.04 |
| 159 |
193122 |
MGC5306 |
unknown |
-0.16 |
0.06 |
| 31 |
669471 |
EST_669471 |
unknown |
-0.15 |
0.04 |
| 39 |
195387 |
EST_195387 |
unknown |
-0.14 |
0.02 |
| 53 |
173878 |
EST_173878 |
unknown |
-0.14 |
0.03 |
| 131 |
324255 |
EST_324255 |
unknown |
-0.14 |
0.04 |
| 23 |
346484 |
FLJ22351 |
unknown |
-0.13 |
0.07 |
| 42 |
195051 |
STRAIT11499 |
unknown |
-0.13 |
0.04 |
| 87 |
809779 |
KIAA0239 |
unknown |
-0.13 |
0.07 |
| 143 |
195903 |
FLJ20624 |
unknown |
-0.13 |
0.05 |
| 150 |
133158 |
MGC5297 |
unknown |
-0.13 |
0.04 |
| 61 |
129293 |
EST_129293 |
unknown |
-0.12 |
0.05 |
| 81 |
262920 |
H41 |
unknown |
-0.12 |
0.03 |
| 155 |
128875 |
SCA2 |
unknown |
-0.12 |
0.03 |
| 13 |
202919 |
DKFZp762N0610 |
unknown |
-0.11 |
0.05 |
| 123 |
306380 |
MGC4276 |
unknown |
-0.11 |
0.04 |
| 130 |
754046 |
DXS9879E |
unknown |
-0.11 |
0.02 |
| 141 |
134172 |
FLJ13855 |
unknown |
-0.11 |
0.05 |
| 128 |
138021 |
FLJ10563 |
unknown |
-0.10 |
0.06 |
| 164 |
142689 |
EST_142689 |
unknown |
-0.10 |
0.07 |
| 192 |
293901 |
EST_293901 |
unknown |
-0.10 |
0.04 |
| 106 |
123815 |
KIAA1259 |
unknown |
-0.09 |
0.06 |
| 133 |
293599 |
FLJ10290 |
unknown |
-0.09 |
0.03 |
| 68 |
812144 |
FLJ20580 |
unknown |
-0.08 |
0.00 |
| 84 |
135561 |
FLJ20188 |
unknown |
-0.08 |
0.03 |
| 104 |
202339 |
EST_202339 |
unknown |
-0.08 |
0.03 |
| 122 |
826166 |
HRIHFB2206 |
unknown |
-0.08 |
0.04 |
| 124 |
203469 |
KIAA0697 |
unknown |
-0.08 |
0.03 |
| 152 |
66406 |
DKFZp762E1312 |
unknown |
-0.08 |
0.04 |
| 178 |
814776 |
MGC14433 |
unknown |
-0.08 |
0.02 |
| 169 |
135273 |
EST_135273 |
unknown |
-0.07 |
0.17 |
| 177 |
130243 |
FLJ11036 |
unknown |
-0.07 |
0.10 |
| 191 |
232908 |
PX19 |
unknown |
-0.07 |
0.02 |
| 207 |
127194 |
FLJ13195 |
unknown |
-0.07 |
0.03 |
| 95 |
825013 |
SSP29 |
unknown |
-0.06 |
0.06 |
| 168 |
296155 |
EST_296155 |
unknown |
-0.06 |
0.07 |
| 97 |
49404 |
KIAA0218 |
unknown |
-0.05 |
0.04 |
| 245 |
195127 |
EST_195127 |
unknown |
-0.05 |
0.12 |
| 173 |
235056 |
EST_235056 |
unknown |
-0.04 |
0.05 |
| 240 |
202034 |
MGC14439 |
unknown |
-0.04 |
0.04 |
| 212 |
208161 |
GW128 |
unknown |
-0.03 |
0.05 |
| 227 |
123614 |
C20ORF55 |
unknown |
-0.03 |
0.05 |
| 243 |
111549 |
EST_111549 |
unknown |
-0.02 |
0.08 |
| 224 |
212704 |
KIAA0170 |
unknown |
-0.01 |
0.07 |
| 221 |
239958 |
KIAA0618 |
unknown |
0.00 |
0.06 |
| 407 |
140197 |
LOC51299 |
unknown |
0.01 |
0.03 |
| 217 |
124808 |
EST_124808 |
unknown |
0.02 |
0.14 |
| 223 |
126466 |
KIAA0467 |
unknown |
0.02 |
0.06 |
| 233 |
115307 |
EST_115307 |
unknown |
0.03 |
0.06 |
| 248 |
111571 |
HP1-BP74 |
unknown |
0.03 |
0.04 |
| 391 |
131563 |
EST_131563 |
unknown |
0.04 |
0.10 |
| 242 |
206949 |
EST_206949 |
unknown |
0.05 |
0.08 |
| 359 |
142397 |
EST_142397 |
unknown |
0.06 |
0.05 |
| 381 |
294647 |
EST_294647 |
unknown |
0.06 |
0.14 |
| 385 |
122126 |
EST_122126 |
unknown |
0.06 |
0.05 |
| 284 |
144924 |
C6ORF5 |
unknown |
0.07 |
0.03 |
| 234 |
140792 |
EST_140792 |
unknown |
0.08 |
0.04 |
| 380 |
144951 |
EST_144951 |
unknown |
0.08 |
0.05 |
| 263 |
206544 |
EST_206544 |
unknown |
0.09 |
0.04 |
| 313 |
52431 |
TDE1 |
unknown |
0.09 |
0.03 |
| 338 |
210415 |
EST_210415 |
unknown |
0.09 |
0.04 |
| 379 |
66391 |
EST_66391 |
unknown |
0.09 |
0.12 |
| 258 |
360079 |
OS-9 |
unknown |
0.11 |
0.02 |
| 262 |
755299 |
ETR101 |
unknown |
0.11 |
0.07 |
| 321 |
136909 |
EST_136909 |
unknown |
0.11 |
0.06 |
| 330 |
292528 |
FLJ23306 |
unknown |
0.11 |
0.06 |
| 341 |
248256 |
KIAA1691 |
unknown |
0.11 |
0.05 |
| 342 |
47475 |
PIR121 |
unknown |
0.12 |
0.06 |
| 403 |
213280 |
EST_213280 |
unknown |
0.12 |
0.16 |
| 252 |
202213 |
EST_202213 |
unknown |
0.13 |
0.06 |
| 357 |
67037 |
EST_67037 |
unknown |
0.13 |
0.17 |
| 352 |
243817 |
EST_243817 |
unknown |
0.14 |
0.01 |
| 402 |
502067 |
KIAA0342 |
unknown |
0.16 |
0.09 |
| 319 |
135673 |
EST_135273 |
unknown |
0.17 |
0.08 |
| 363 |
113284 |
EST_113284 |
unknown |
0.18 |
0.06 |
| 317 |
292388 |
LOC55977 |
unknown |
0.19 |
0.04 |
| 314 |
726678 |
KIAA0275 |
unknown |
0.23 |
0.07 |
| 389 |
110996 |
EST_110996 |
unknown |
0.26 |
0.14 |
| 390 |
110582 |
EST_110582 |
unknown |
0.28 |
0.09 |
Supplement S3. Comparison of regulated gene
signatures in HIV-1BRU infections of CD4+ T
cell-lines. Table depicts numbers of regulated genes (P=0.005) for
each cell line, number of common- and anti-regulated genes for each
comparison and correlation coefficient (R) for either all observations
or the genes in the common signature. * Anti-correlated gene names
listed in table below.
| Compare |
Query |
Target |
Common |
Anti |
R all |
R common |
| CEM#1-CEM#2 |
361 |
616 |
224 |
4 |
0.922 |
0.992 |
| CEM#1-CEM#3 |
341 |
290 |
121 |
1 |
0.891 |
0.994 |
| CEM#2-CEM#3 |
574 |
290 |
161 |
2 |
0.871 |
0.992 |
| CEM HI-CEM#1 |
274 |
361 |
121 |
1 |
0.941 |
0.997 |
| CEM HI-CEM#2 |
274 |
616 |
152 |
4 |
0.910 |
0.991 |
| CEM HI-CEM#3 |
256 |
290 |
99 |
0 |
0.903 |
0.997 |
| CEM#2-CEMss |
616 |
257 |
141 |
2* |
0.858 |
0.985 |
| CEM#2-CEMfh |
616 |
378 |
209 |
0 |
0.866 |
0.980 |
| CEM#2-Jurkat |
616 |
440 |
156 |
15* |
0.704 |
0.960 |
| CEM#2-SupT1 |
616 |
447 |
179 |
6* |
0.716 |
0.963 |
| CEMss-CEMfh |
257 |
378 |
156 |
0 |
0.903 |
0.579 |
| CEMss-Jurkat |
257 |
440 |
68 |
4* |
0.676 |
0.984 |
| CEMss-SupT1 |
257 |
447 |
95 |
2 |
0.716 |
0.985 |
| CEMfh-Jurkat |
378 |
440 |
102 |
5* |
0.688 |
0.971 |
| CEMfh-SupT1 |
378 |
447 |
133 |
5* |
0.726 |
0.966 |
| Jurkat-SupT1 |
440 |
447 |
129 |
7* |
0.602 |
0.957 |
| Compare |
Anti-correlated genes |
| CEM#2-CEMss |
HSU79266, STE |
| CEM#2-Jurkat |
GCKR, RPML3, RCN2, H2AFL, PX19, BCL2A1, PPP1CA, MCM3, MYBL2, TCF7, EST_131877, BIRC3, ELAVL1, ACVR1, ACTB |
| CEM#2-SupT1 |
SLA, EGR1, PTPRA, STRAIT11499, SCAMP3, LOC51299 |
| CEMss-Jurkat |
RPML3, GBP1, PCYT2, TCF7 |
| CEMfh-Jurkat |
XRCC1, DTYMK, RPML3, CD5, TCF7 |
| CEMss-SupT1 |
PRKACA, STRAIT11499 |
| CEMfh-SupT1 |
EST_120823, EST_139962, STRAIT11499, IGF2, GALNT2 |
| Jurkat-SupT1 |
OPRK1, BRF2, EGR1, STRAIT11499, BCL2A1, TCF7, CXCR4 |